Greetings to all,
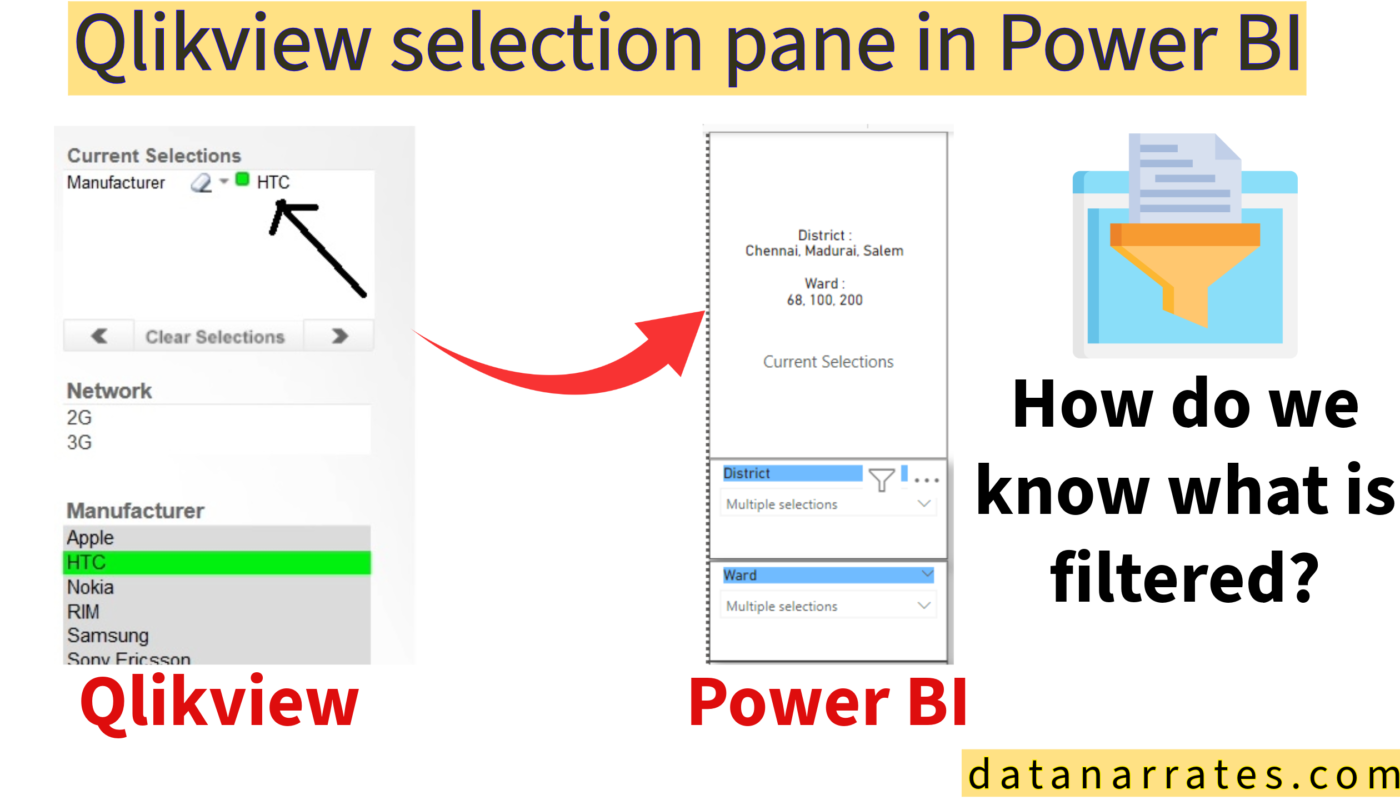
Qlikview is one of the business intelligence tool to visualize the data and took decisions in an organization. Earlier days of business insights was given using this Qlik tool. After Power BI growth will go exponentially many organizations are adapted to Power BI as graphical visualization tool to analyze their data. When migrating from Qlikview to Power BI there is some features in Qlikview is they would like to see in PowerBI too. Agreed that every tool has different king of functioning and operating style to give the data insights.
In this use case will create a current selection pane similar like Qlikview tool. It is not exactly the same one but the end user requested to have a current selection pane like Qlikview is give more comfortable to use power bi. So we will try to create the current selection pane in power bi, there is no direct straight forward way to create this using DAX we will create the selection pane as same as Qlikview.
Lets go to the example,
I have multiple slicer field in a single page, Now I want to see what are all the selections in the slicer in a selection pane. For this I will create current selection DAX,
Current Selections =
Var _Filter = IF (
ISFILTERED (Sheet1[City]),
VAR ___f = FILTERS ( Sheet1[City])
VAR ___r = COUNTROWS ( ___f )
VAR ___t = TOPN ( 10, ___f, Sheet1[City] )
VAR ___d = CONCATENATEX ( ___t,Sheet1[City], “, ” )
VAR ___x = “City : ” & UNICHAR(13) & UNICHAR(10)& ___d & IF(___r > 10, “, … [” & ___r & ” City selected]”) & ” “
RETURN ___x & UNICHAR(13) & UNICHAR(10) & UNICHAR(13) & UNICHAR(10)
)
&
IF (
ISFILTERED (Sheet1[District]),
VAR ___f = FILTERS ( Sheet1[District])
VAR ___r = COUNTROWS ( ___f )
VAR ___t = TOPN ( 10, ___f, Sheet1[District] )
VAR ___d = CONCATENATEX ( ___t,Sheet1[District], “, ” )
VAR ___x = “District : ” & UNICHAR(13) & UNICHAR(10)& ___d & IF(___r > 10, “, … [” & ___r & ” District selected]”) & ” “
RETURN ___x & UNICHAR(13) & UNICHAR(10) & UNICHAR(13) & UNICHAR(10)
)
&
IF (
ISFILTERED (Sheet1[Ward]),
VAR ___f = FILTERS ( Sheet1[Ward])
VAR ___r = COUNTROWS ( ___f )
VAR ___t = TOPN ( 10, ___f, Sheet1[Ward] )
VAR ___d = CONCATENATEX ( ___t,Sheet1[Ward], “, ” )
VAR ___x = “Ward : ” & UNICHAR(13) & UNICHAR(10)& ___d & IF(___r > 10, “, … [” & ___r & ” Ward selected]”) & ” “
RETURN ___x & UNICHAR(13) & UNICHAR(10) & UNICHAR(13) & UNICHAR(10)
)
&
IF (
ISFILTERED (Sheet1[Educated Ratio]),
VAR ___f = FILTERS ( Sheet1[Educated Ratio])
VAR ___r = COUNTROWS ( ___f )
VAR ___t = TOPN ( 10, ___f, Sheet1[Educated Ratio] )
VAR ___d = CONCATENATEX ( ___t,Sheet1[Educated Ratio], “, ” )
VAR ___x = “Educated Ratio : ” & UNICHAR(13) & UNICHAR(10)& ___d & IF(___r > 10, “, … [” & ___r & ” Educated Ratio selected]”) & ” “
RETURN ___x & UNICHAR(13) & UNICHAR(10) & UNICHAR(13) & UNICHAR(10)
)
Return
IF( ISBLANK(_Filter), “No Filters Applied”, _Filter)
Using sample data exercise:


By using IF, FILTERS, COUNTROWS, TOPN, CONCATENATEX, UNICHAR we create a result which will show what are all selected or filtered in the slicer in Power BI.
To Understand the above DAX, breakthrough each line and the DAX functions and we can clearly understand the code. I am not taking too much time to explain the above functions I will leave it to you.
Thanks


